PEO Benefits Comparison Guide for Brokers (2026)
Professional Employer Organizations (PEOs) offer small businesses access to enterprise-level benefits through co-employment arrangements. For brokers, comparing PEO options requires a fundamentally different approach than traditional carrier comparisons—you're not just comparing health plans, but entire HR ecosystems.
Understanding the PEO Landscape
The PEO industry has grown significantly, with NAPEO reporting over 500 PEOs serving approximately 4 million worksite employees across the US. For brokers, this presents both opportunity and complexity. Unlike traditional benefits, PEO arrangements bundle multiple services together, making apples-to-apples comparison challenging.
The key insight: PEO comparisons must account for the total cost of engagement, not just health premiums. A PEO with higher health rates might still deliver better value when you factor in admin fee savings, bundled services, and reduced compliance burden.
Industry Insight: The 2026 PEO Market
The PEO market continues to consolidate, with larger PEOs acquiring regional players. This means better carrier negotiations and more sophisticated technology platforms, but also more complex pricing structures. Brokers who can decode these structures add significant value.
Why PEO Comparisons Are Different
Traditional carrier comparisons focus on a single dimension: health plan costs and benefits. PEO comparisons require multi-dimensional analysis:
- Master health plan options: Limited compared to open market, but often better rates
- Admin fees: The "cost of doing business" with the PEO
- Bundled services: Payroll, HR, compliance, workers' comp included or extra?
- Co-employment implications: Who's the employer of record for what?
- Exit costs: What happens if the relationship doesn't work out?
The PEO Comparison Framework
Use this structured approach to compare PEO arrangements systematically:
Step 1: Inventory Master Health Plan Options
Request the complete menu of health plans available through each PEO. Unlike the open market where you can quote any carrier, PEOs limit options to their contracted carriers—typically 2-4 carrier relationships with 3-6 plan designs each.
For each plan, document:
- Carrier and network (BCBS, UHC, Aetna, Cigna, regional options)
- Plan design (deductible, copays, coinsurance, OOP max)
- Network adequacy for the client's locations
- Prescription drug formulary and specialty drug coverage
- Rates by tier (Employee, EE+Spouse, EE+Child, Family)
Sample Master Plan Inventory
| PEO | Carrier | Plan Type | EE Only | Family |
|---|---|---|---|---|
| PEO Alpha | BCBS | PPO $1,500 | $485 | $1,420 |
| PEO Alpha | BCBS | HDHP $3,000 | $395 | $1,180 |
| PEO Beta | UHC | PPO $2,000 | $510 | $1,490 |
| PEO Beta | UHC | HDHP $2,800 | $415 | $1,210 |
Step 2: Decode Admin Fee Structures
Admin fees are where PEO comparisons get complicated. There are two primary structures:
Per-Employee-Per-Month (PEPM)
A flat fee per employee regardless of salary. Typical range: $80-$200 PEPM depending on services included. This structure favors employers with higher-paid employees.
Percentage of Payroll
A percentage of gross payroll, typically 2-8%. This structure favors employers with lower-paid employees or high turnover (fewer total payroll dollars).
Critical: Get the Complete Fee Schedule
Many PEOs advertise a low base admin fee but charge extra for "optional" services that most employers need. Always request the complete fee schedule including: background checks, I-9 verification, COBRA administration, FSA/HSA administration, 401(k) recordkeeping, time and attendance, and termination processing fees.
Step 3: Map Bundled Services
Create a service matrix to understand what's included vs. extra:
- Payroll processing: Almost always included, but frequency matters (weekly costs more)
- Tax filing and compliance: Should be included in any PEO arrangement
- HR support: On-demand vs. dedicated representative?
- Employee handbook and policies: Template or custom?
- Workers' compensation: Pay-as-you-go or annual audit?
- EPLI coverage: Included, available, or not offered?
- 401(k) administration: Often available but with additional fees
- Time and attendance: Basic or advanced scheduling?
- Recruiting and onboarding: Usually extra or limited
Step 4: Calculate Total Cost of Engagement
Now combine everything into a single annual cost model:
Total Cost Formula
Annual Health Premiums (employer portion)
+ Annual Admin Fees
+ Additional Service Fees
+ Workers' Comp Premium
+ Implementation/Setup Fees (amortized)
- Value of Services Otherwise Outsourced
= Net Total Cost of Engagement
The "Value of Services Otherwise Outsourced" line is crucial. If the employer currently pays $500/month for payroll, $200/month for HR software, and $150/month for time tracking—that's $10,200/year of value that the PEO bundle provides. Subtract this from the PEO's admin fees for a true comparison.
Step 5: Model Multiple Scenarios
Don't present a single recommendation. Model at least three scenarios:
- PEO A with PPO plan: Higher premiums, lower employee cost sharing
- PEO B with HDHP + HSA: Lower premiums, employer funds HSA
- Traditional broker-managed: Open market plans, unbundled services
This allows the client to see trade-offs and make an informed decision based on their priorities—whether that's cost minimization, benefit richness, or administrative simplicity.
PEO vs. Traditional: Decision Framework
Not every employer is a good PEO candidate. Use this framework:
PEO Makes Sense When:
- Employer has 10-150 employees (the PEO sweet spot)
- Limited or no internal HR infrastructure
- Multi-state operations requiring compliance expertise
- High-risk industry where workers' comp is expensive
- Rapid growth requiring scalable HR processes
- Owner wants to focus on business, not benefits administration
Traditional May Be Better When:
- Employer has sophisticated HR team in place
- Industry-specific carrier relationships matter
- Company culture requires maximum plan flexibility
- Admin fees exceed the value of bundled services
- Previous negative PEO experience
- Complex compensation structures (commissions, bonuses) create payroll challenges
Common PEO Comparison Mistakes
Avoid these pitfalls that lead to bad recommendations:
Mistake 1: Comparing Only Health Premiums
This is the most common error. A PEO with 10% higher health premiums but $50 lower PEPM admin fees might actually cost less overall. Always calculate total cost of engagement.
Mistake 2: Ignoring Network Adequacy
PEOs have limited carrier options. If the available networks don't include the client's employees' doctors or local hospitals, the "savings" become meaningless. Always verify network adequacy for all employee locations.
Mistake 3: Overlooking Exit Provisions
Some PEOs have punitive termination clauses—early termination fees, data extraction charges, or delayed final payroll processing. Review contracts carefully and model exit scenarios.
Mistake 4: Not Valuing Time Savings
The owner spending 10 hours/month on HR tasks at an implied value of $200/hour is $24,000/year. If a PEO eliminates 80% of that burden, the value is $19,200—often more than the admin fees. Quantify this.
Mistake 5: Assuming All PEOs Are Equal
PEOs vary dramatically in service quality, technology, and responsiveness. Request references, check NAPEO membership, and verify IRS certification (CPEO status). A cheap PEO that creates payroll problems costs far more than a premium PEO that runs smoothly.
Presenting Your PEO Recommendation
Structure your client presentation for maximum clarity:
- Executive summary: One-page comparison of options with total annual costs
- Health plan comparison: Side-by-side benefit summaries
- Admin fee breakdown: What's included, what's extra, what it costs
- Service comparison matrix: Feature-by-feature comparison
- Implementation timeline: What happens when
- Recommendation with rationale: Your professional guidance
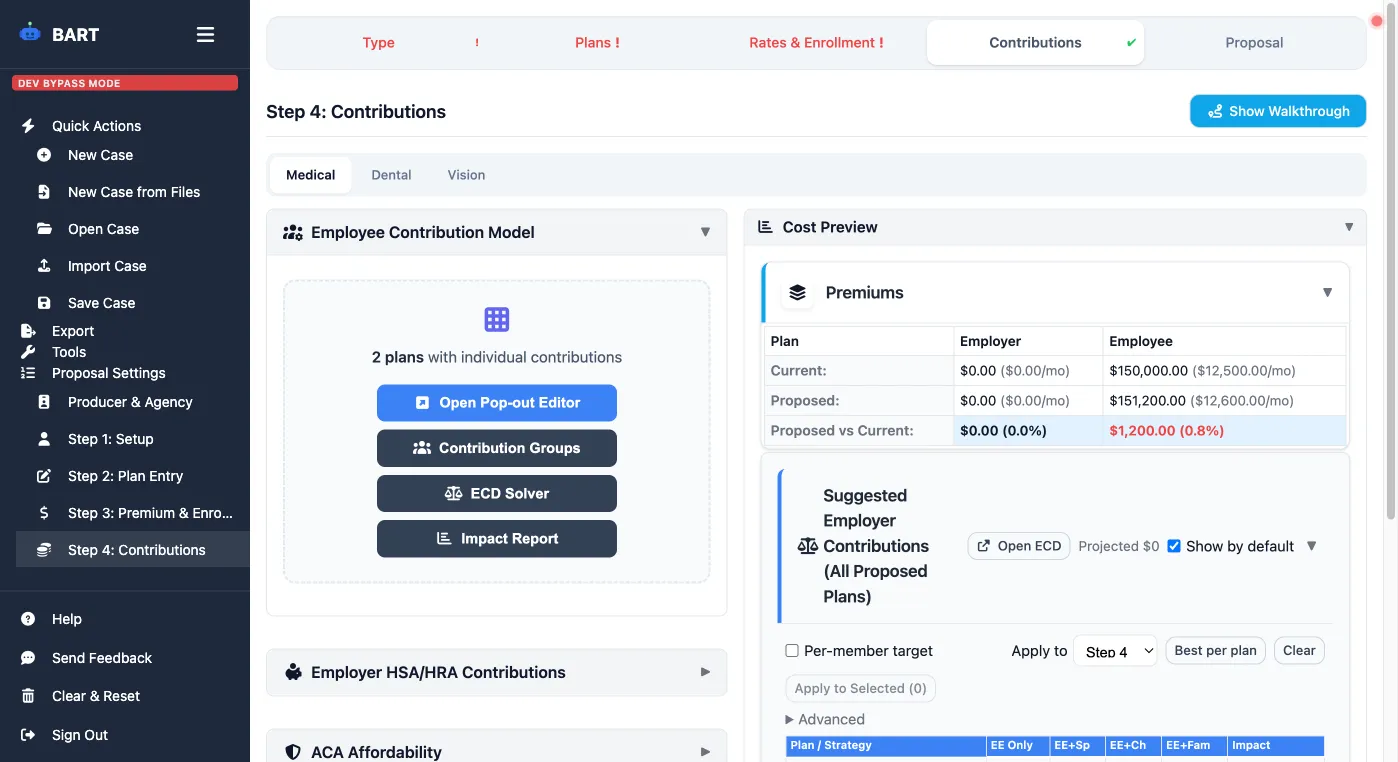
Model PEO Arrangements in BART
BART helps you compare PEO master plans, model admin fee impacts, calculate payroll deductions, and generate client-ready comparison reports—all in one workflow.
Payroll Deduction Calculations
Once a PEO is selected, you'll need to calculate payroll deductions. Different pay frequencies require different calculations:
- Weekly (52 periods): Annual EE cost ÷ 52
- Bi-weekly (26 periods): Annual EE cost ÷ 26
- Semi-monthly (24 periods): Annual EE cost ÷ 24
- Monthly (12 periods): Annual EE cost ÷ 12
Common mistake: confusing bi-weekly (every two weeks = 26 periods) with semi-monthly (1st and 15th = 24 periods). This creates reconciliation issues at year-end.
Conclusion: Adding Value in PEO Comparisons
PEO comparisons are complex, which is exactly why clients need broker expertise. By modeling total cost of engagement, mapping service bundles, and presenting clear recommendations, you demonstrate value that justifies your commission and builds long-term relationships.
The brokers who thrive in the PEO space are those who can translate complexity into clarity—helping clients see not just what they're buying, but why it makes sense for their specific situation.