KFF Benchmarking Guide for Benefits Brokers
Learn how to use Kaiser Family Foundation employer health benefits survey data to benchmark client costs, strengthen negotiations, and demonstrate your value as a broker.
What is KFF Benchmarking?
The Kaiser Family Foundation (KFF) Employer Health Benefits Survey is the most widely cited source for employer-sponsored health insurance data in the United States. Published annually since 1999, this survey collects data from over 2,000 employers to establish national benchmarks for:
- Average premium costs for single and family coverage
- Employer and employee contribution percentages
- Plan type distribution (PPO, HMO, HDHP, POS)
- Deductible and out-of-pocket maximum levels
- Year-over-year cost trends
For benefits brokers, KFF data provides an authoritative, defensible baseline for comparing your clients' benefits against national averages.
Why KFF Benchmarking Matters for Brokers
1. Credibility in Client Presentations
When you tell a client their premiums are "competitive," they want proof. KFF data lets you say:
"Your average family premium of $22,500 is 6% below the KFF national average of $23,968—you're already getting good value."
This transforms subjective opinions into data-driven insights that clients trust.
2. Negotiation Leverage with Carriers
When a carrier presents a 12% renewal increase, you can push back with data:
"The KFF survey shows national premiums increased 7% year-over-year. A 12% increase puts this group significantly above market trends—we need to revisit these numbers."
3. Plan Design Recommendations
KFF data helps you guide clients toward industry-appropriate plan designs. For example:
- HDHP Adoption: KFF shows 29% of covered workers are in HDHPs nationally. If your client hasn't considered an HDHP option, benchmarks help make the case.
- Deductible Levels: The average single deductible is $1,735. If your client's deductible is $500, you can show they're paying more in premium for richer coverage.
Key KFF Metrics to Know
Here are the essential benchmarks from the 2024 KFF survey that every broker should have at their fingertips:
2024 KFF Benchmark Highlights
Annual Premiums
- Single: $8,435 average
- Family: $23,968 average
Employer Contributions
- Single: 83% employer / 17% employee
- Family: 73% employer / 27% employee
Average Deductibles
- All Plans: $1,735 (single)
- HDHP: $2,459 (single)
Plan Type Distribution
- PPO: 47%
- HDHP: 29%
- HMO: 13%
Source: KFF 2024 Employer Health Benefits Survey
How to Use KFF Benchmarking in BART
BART integrates KFF survey data directly into your workflow. Here's how to use it:
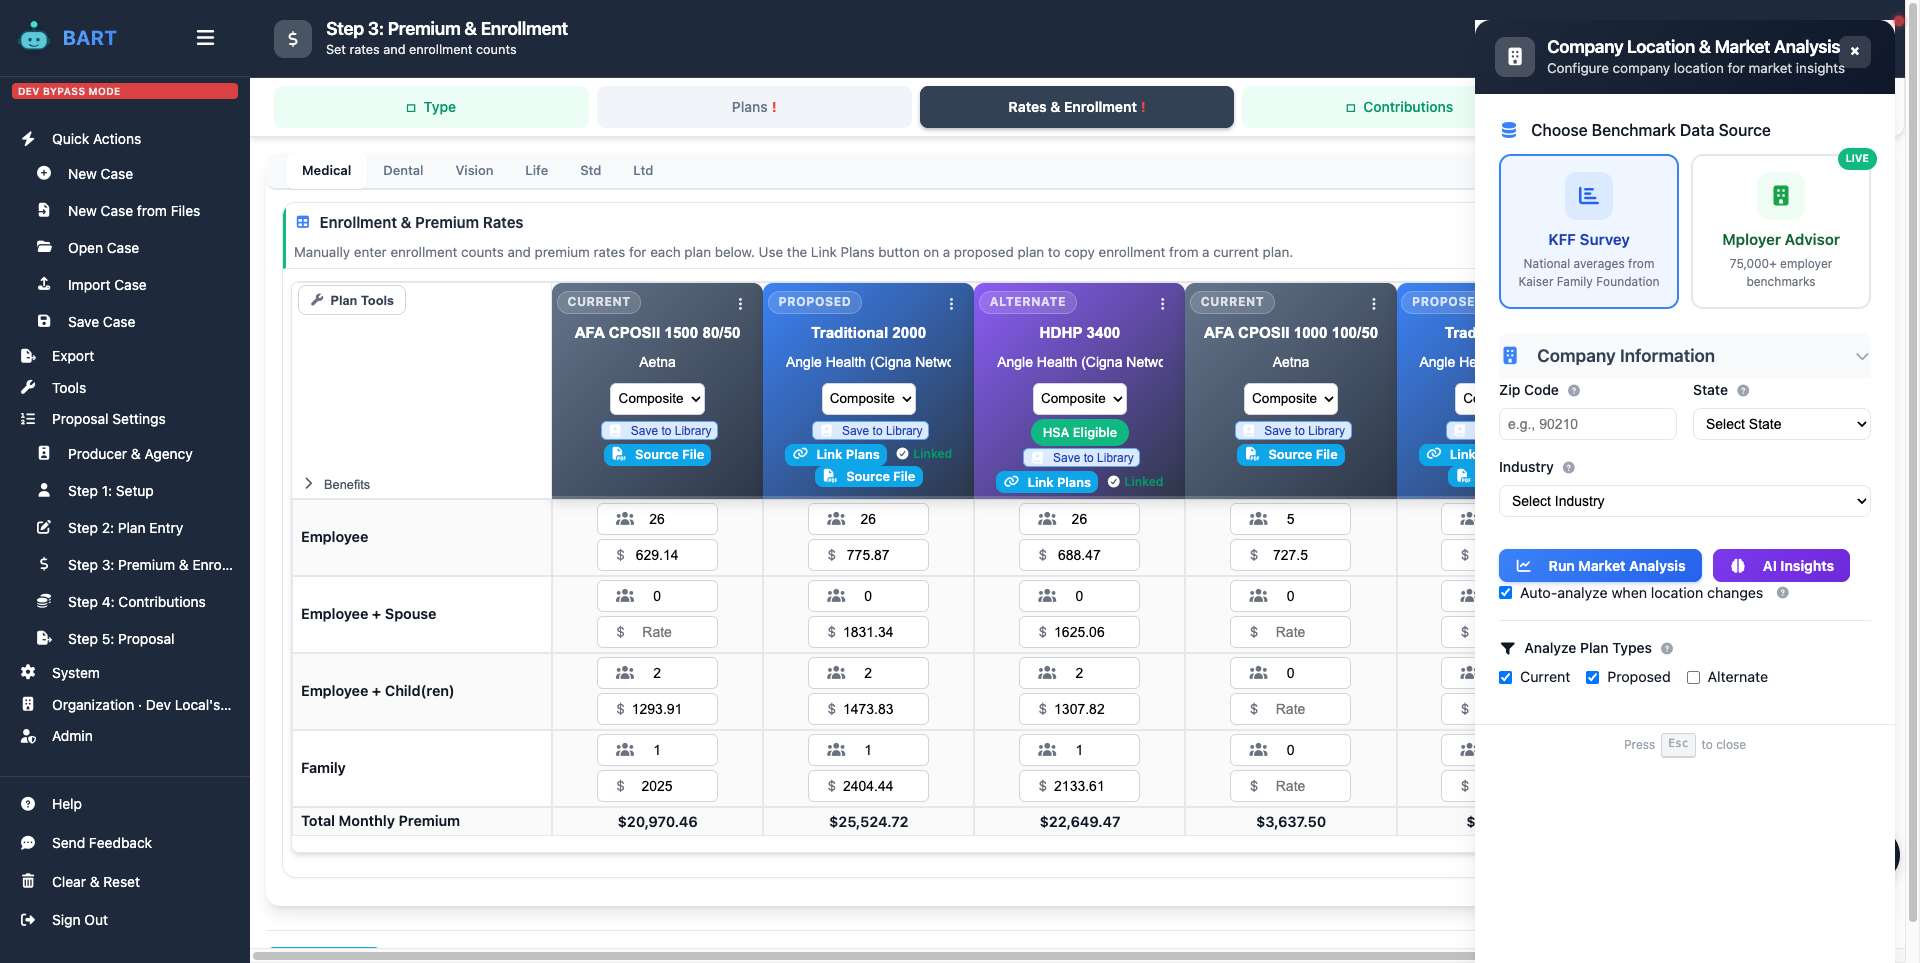
Step 1: Access Market Analysis
From any case in BART, click the Market Analysis button (chart icon) in the workspace header. This opens the benchmarking panel.
Step 2: Select Your Data Source
Choose KFF Survey for national benchmarks based on Kaiser Family Foundation data. Alternatively, select Mployer Advisor for live benchmark data from 75,000+ employers.
Step 3: Configure Company Information
Enter the client's location and industry for more relevant comparisons:
- Zip Code: Enables regional cost adjustments
- State: Accounts for state-specific regulations
- Industry: Healthcare, technology, manufacturing, etc.
Step 4: Run the Analysis
Click Run Market Analysis to generate a comparison report. BART will show how the current and proposed plans compare to KFF benchmarks across premiums, employer contributions, and plan design elements.
Step 5: Generate AI Insights
Click AI Insights for narrative summaries that you can use directly in client presentations. The AI highlights key findings like:
- "Employer contribution is 8% below the national average"
- "Premium increase of 5% is below the 7% national trend"
- "HDHP adoption aligns with industry benchmarks"
Benchmarking by Firm Size
KFF segments data by employer size, which matters because small and large firms have different cost structures:
| Firm Size | Avg Family Premium | ER Contribution |
|---|---|---|
| Small (3-199 workers) | $22,490 | 67% |
| Large (200+ workers) | $24,278 | 77% |
| All Firms | $23,968 | 73% |
Use firm-size benchmarks to set appropriate expectations. A 50-employee company shouldn't necessarily match the contribution levels of a Fortune 500 firm.
Industry-Specific Benchmarks
Different industries have different benefit philosophies. KFF provides industry breakdowns that help you counsel clients appropriately:
- Healthcare/Social Assistance: Often have richer benefits to attract clinical staff
- Technology: Competitive packages to attract talent in a tight labor market
- Retail/Hospitality: Lower contribution rates due to high turnover and thin margins
- Manufacturing: Union influence often results in richer benefits
Common Benchmarking Pitfalls to Avoid
Don't Compare Apples to Oranges
A 20-employee retail business shouldn't be benchmarked against the national average for all firms. Use the appropriate segment—small firms in retail—for meaningful comparisons.
Don't Ignore Regional Variations
Health insurance costs vary significantly by geography. Northeast costs are typically 15-20% higher than the South. KFF provides regional data when available.
Don't Rely Solely on Averages
Averages can mask significant variation. When possible, look at percentile distributions to understand where your client falls in the overall landscape.
Building Benchmarking Into Your Workflow
Make KFF benchmarking a standard part of your renewal and prospecting process:
- Initial Analysis: Run benchmarks when you first receive renewal quotes to frame the conversation
- Carrier Negotiation: Use benchmark data to support requests for better rates
- Client Presentation: Include benchmark comparisons in every proposal deck
- Annual Review: Show clients how their benefits compare year over year against national trends
Next Steps
Ready to start using KFF benchmarking in your practice? BART makes it easy to access authoritative benchmark data and integrate it into your proposals.
Try KFF Benchmarking in BART
Start your free proposal and see how your clients compare to national benchmarks.
Start Free Proposal