Employee Cost Difference Analysis: Show Plan Impact Clearly
"How will this affect my paycheck?" It's the first question employees ask about benefits changes. Percentage increases and total cost figures mean little to individuals. Cost difference analysis translates plan changes into personal financial impact—dollars per pay period that employees can understand and act on.
Why Cost Difference Analysis Matters
Benefits decisions happen at two levels: organizational (what plans to offer, how to fund them) and individual (what each employee chooses). Cost difference analysis bridges these levels by translating abstract plan changes into concrete personal impact.
Consider a 6% premium increase. For HR and finance, that's a budget line item. For an employee, the question is: "Will I pay $5 more per paycheck or $50?" That context determines whether employees view the change as reasonable or alarming.
The Decision Support Gap
Employers spend weeks analyzing plan options. Employees get 15 minutes during open enrollment to make the same decision. Cost difference analysis compresses complex financial modeling into digestible, actionable information that empowers better choices.
The Complete Cost Difference Formula
At its core, cost difference analysis compares two scenarios: current state and proposed state. The formula captures multiple dimensions:
Where:
• EE Cost = Total Premium × Employee Share % (after employer contribution)
• Period = Pay frequency (weekly, bi-weekly, semi-monthly, monthly)
• Include: premium changes, contribution strategy changes, plan design value changes
The complexity comes from accurately capturing all factors that affect employee out-of-pocket costs—not just premiums, but deductibles, copays, HSA contributions, and other plan design elements.
What to Include in Cost Analysis
Direct Premium Impact
The most visible cost change. When carrier rates increase or employer contribution percentages change, employees see immediate paycheck impact:
- Rate changes: Premium increases or decreases from renewal
- Contribution shifts: Employer paying 75% instead of 80%
- Tier restructuring: Changes to how EE+Spouse vs. EE+Children vs. Family are priced
- Plan swaps: Moving from one carrier or plan design to another
Plan Design Value Changes
Premiums aren't the whole story. A plan with higher premiums but lower deductibles might cost less total. Include:
- Deductible differences: A $1,000 deductible reduction has real value
- Out-of-pocket maximum changes: Risk exposure differences
- Copay variations: $20 vs. $40 PCP visits compound over the year
- Coinsurance rates: 80/20 vs. 70/30 affects major claims
Employer Contributions Beyond Premiums
Modern benefits packages include employer contributions beyond premium sharing:
- HSA contributions: Employer HSA seed money offsets HDHP costs
- HRA funding: Employer-funded HRA accounts
- Wellness incentives: Premium discounts for health activities
- Dependent care FSA matching: Additional employer support
Critical: Net Cost vs. Premium Cost
Don't confuse "employee premium" with "employee net cost." If an employer adds $500/year HSA contribution when moving to an HDHP, that $500 offsets premium increases. Always present the complete picture.
Building a Cost Difference Report: Step-by-Step
Step 1: Document Current State by Tier
Start with what employees pay today. Capture every coverage tier separately—they often change differently:
| Coverage Tier | Monthly Premium | ER Contribution (75%) | EE Cost/Month |
|---|---|---|---|
| Employee Only | $650 | $487.50 | $162.50 |
| EE + Spouse | $1,365 | $1,023.75 | $341.25 |
| EE + Children | $1,105 | $828.75 | $276.25 |
| Family | $1,820 | $1,365.00 | $455.00 |
Current state baseline: 75% employer contribution across all tiers
Step 2: Calculate Proposed State
Apply renewal changes, new contribution strategies, or alternative plan options to calculate proposed employee costs. In this example, premiums increased 8% but employer increased contribution to 78%:
| Coverage Tier | New Premium (+8%) | ER Contribution (78%) | EE Cost/Month |
|---|---|---|---|
| Employee Only | $702 | $547.56 | $154.44 |
| EE + Spouse | $1,474 | $1,149.72 | $324.28 |
| EE + Children | $1,193 | $930.54 | $262.46 |
| Family | $1,966 | $1,533.48 | $432.52 |
Proposed state: 8% premium increase absorbed by 3% higher ER contribution
Step 3: Compute the Difference
Now the magic: subtract current from proposed to show the impact in employee terms:
| Coverage Tier | Current EE Cost | Proposed EE Cost | Monthly Diff | Annual Diff |
|---|---|---|---|---|
| Employee Only | $162.50 | $154.44 | -$8.06 | -$96.72 |
| EE + Spouse | $341.25 | $324.28 | -$16.97 | -$203.64 |
| EE + Children | $276.25 | $262.46 | -$13.79 | -$165.48 |
| Family | $455.00 | $432.52 | -$22.48 | -$269.76 |
Despite 8% premium increase, all employees see cost decreases due to enhanced contribution
Step 4: Convert to Pay Period
Monthly differences matter for budgeting, but employees think in paychecks. Convert to the employer's pay frequency:
Pay Period Conversion (Family Tier Example)
Monthly difference: -$22.48
Annual difference: -$22.48 × 12 = -$269.76
---
Weekly (52 periods): -$269.76 ÷ 52 = -$5.19/week
Bi-weekly (26 periods): -$269.76 ÷ 26 = -$10.38/paycheck
Semi-monthly (24 periods): -$269.76 ÷ 24 = -$11.24/paycheck
Step 5: Add Context and Value
Raw numbers need framing. When costs increase, explain the value. When costs decrease, reinforce the positive outcome:
- For increases: "You'll pay $15 more per month, but your deductible drops from $3,000 to $1,500—you come out ahead if you have any significant claims."
- For decreases: "Your premium drops $10 per paycheck while maintaining the same network and benefits."
- For HDHP moves: "Your premium is $50 lower, plus you receive a $750 HSA contribution from the employer—a net benefit of $1,350 annually."
Presenting Cost Differences Effectively
Use Clear Visual Hierarchy
Cost difference reports serve multiple audiences. Structure for scanning:
- Lead with the headline number: "All tiers see cost decreases this renewal"
- Show all tiers at once: Employees immediately find their tier
- Color-code direction: Green for savings, red for increases
- Include multiple timeframes: Per-paycheck feels smaller than annual
Multiple Scenario Comparison
Often you're comparing more than current vs. proposed. Present options side-by-side:
| Scenario | EE Only | EE+Spouse | EE+Child | Family |
|---|---|---|---|---|
| Current (Baseline) | $162.50 | $341.25 | $276.25 | $455.00 |
| Option A: Keep 75% | +$12.50 | +$27.50 | +$22.00 | +$36.50 |
| Option B: Increase to 78% | -$8.06 | -$16.97 | -$13.79 | -$22.48 |
| Option C: HDHP + $500 HSA | -$45.00 | -$52.00 | -$48.00 | -$65.00 |
Monthly difference from current state across three renewal options
Segment by Employee Population
Aggregate cost difference data to understand organizational impact:
- Winners vs. losers: What percentage of employees see increases vs. decreases?
- Average impact: Mean cost change across the population
- Distribution: Are a few employees absorbing most of the increase?
- Tier mix: If 70% are Employee Only, family-tier changes matter less overall
Common Use Cases
Renewal Negotiations
When presenting renewal options to employers, cost difference analysis makes abstract rate increases concrete. Instead of "8% increase," show: "Family coverage employees would pay $37 more per month, but Employee-Only would only see $13."
Plan Design Changes
Moving from PPO to HDHP with HSA? Cost difference analysis reveals the net impact after employer HSA contributions. Many employees are surprised that HDHP + HSA funding costs them less than traditional plans.
Contribution Strategy Shifts
When employers restructure contributions (e.g., from percentage to fixed dollar, or from equal tiers to composite rates), cost difference analysis identifies which employee groups benefit and which pay more.
Mid-Year Qualifying Events
When employees experience qualifying events (marriage, birth, divorce), show how their costs change under different enrollment options.
Mistakes to Avoid
Showing Only Percentages
A 5% increase sounds small. But 5% of $500/month is $25/month or $300/year. Always include dollar amounts that employees can relate to their budgets.
Forgetting Tier-Level Differences
Rate structures often change differently by tier. A renewal might be favorable for Employee Only but punitive for families. Show every tier—no surprises.
Ignoring the Value Equation
If costs increase, what does the employee get? Lower deductibles? Better network? HSA contribution? Cost without context creates anxiety. Cost with value creates informed decisions.
Using Wrong Pay Frequency
If an employer has bi-weekly payroll (26 periods) but you present monthly differences, employees can't connect the numbers to their paychecks. Match the pay frequency.
Not Including All Compensation
Employer HSA contributions, wellness incentives, and HRA funding are part of total compensation. A "premium increase" might be a net decrease when these are included.
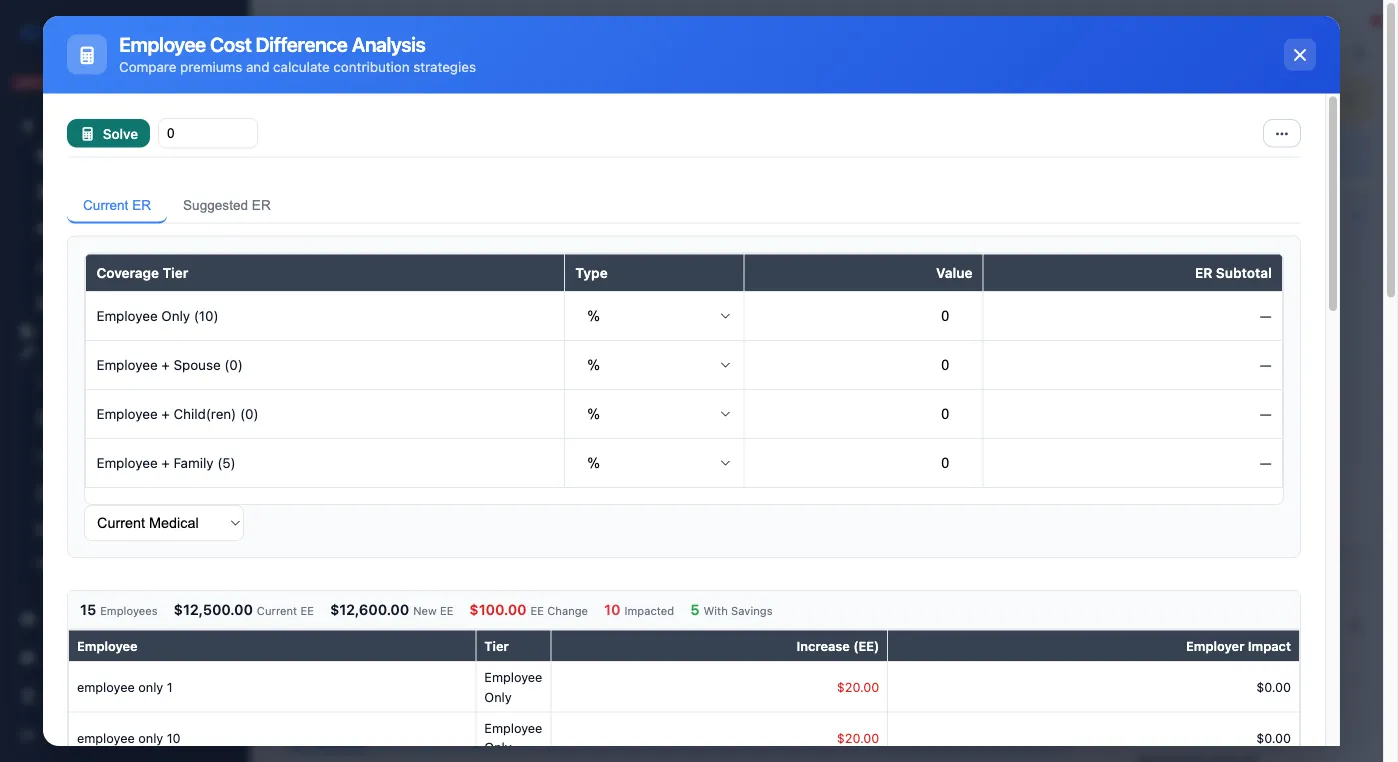
Calculate Cost Differences Instantly
BART automatically calculates employee cost differences across all tiers and pay frequencies, showing exactly how plan changes affect every employee.
Strategic Value Beyond Presentations
Anticipate Open Enrollment Questions
Cost difference analysis prepared before open enrollment lets HR and benefits teams anticipate questions. When employees ask "why is my premium higher?", you have the data ready.
Justify Employer Investment
When employers increase their contribution to absorb renewal increases, cost difference analysis demonstrates the value. "The employer absorbed $150,000 of renewal increase so employee costs stay flat" is a powerful retention message.
Model What-If Scenarios
Before finalizing contribution strategy, model alternatives. What if we contributed 80% instead of 75%? What if we offered a buy-up option? Cost difference analysis makes scenarios tangible.
Conclusion: Making Changes Tangible
Benefits changes are abstractions until they hit paychecks. Cost difference analysis bridges the gap between organizational decisions and individual impact. When you can show every employee exactly what a plan change means in dollars per paycheck, you enable informed decisions and minimize enrollment-season surprises.
The best cost difference reports are clear, comprehensive, and contextualized. They show the numbers, explain the value, and present information in terms employees understand. Whether you build reports manually or use automation tools, these principles remain constant.